I have been home from Pass Summit 2016 for less than two days and needed to express some of the greatness last week had. First I’d like to share something personal; I had the great fortune of padding a few days before and a few days after the Summit for some fun and sight seeing. I got to visit Woodinville one day on both weekends and it was pretty amazing. If you want to skip and get to just the news click here.
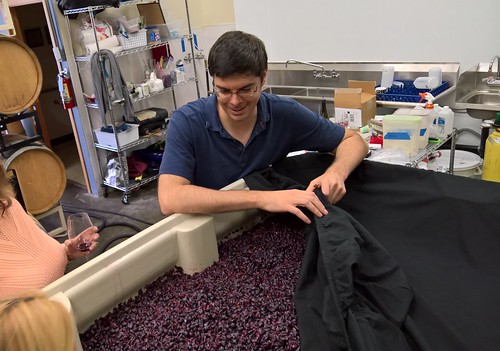
On our first trip we met Kevin White at his winery. There were 2 things that made visiting with him so memorable. Currently in Washington everyone is working on wine, it’s what they call CRUSH. Kevin took us to the back and showed us what a pile of crushed grapes looks like, he failed to mention how overwhelming the smell is. Don’t worry it smelled good. Second thing was he works at Microsoft and been on several projects we had all heard of. Has now become an analytics kind of guy. How amazing is that 3 data nerds run into a winemaker/data nerd who makes great wine?(Shhh! We joined the club.)
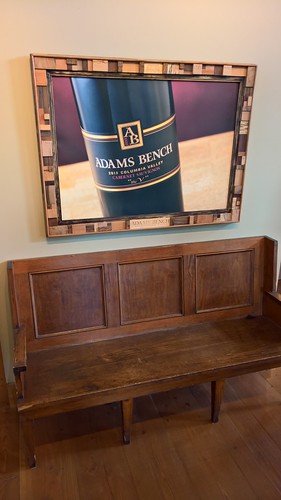
On our second trip our dear friend Max led the way and took us to places he loves the most. One very special place we were told “Tim” is open today but just for a few folks and only till about 4pm. We had a nice chat with Tim and when he asked where we were all from, the “originally from Indiana” struck a cord. He too was from Indiana and grew up just south of Warsaw in Pulaski County. His dad was a school teacher at Adams Elementary, which of course is where Tim went to school. Tim told us that his dad later went on to be the assistant principle, principle and later led the school board. He walked us over to this bench and said “See this bench? It’s from Adams Elementary and was the one that sat outside the principle’s office.” How amazing that we went all the way to Washington to see a artifact form Indiana. Ok besides the great story, his wine is AMAZING!!!!!! Adams Bench had great big reds and we loved it. Ok we joined this club too, and a shipment is on it’s way.
News and Info from Pass Summit 2016
Not everyone gets to attend Summit and that is sad because such great things happen there. This year there was lots of great things going on and I wanted to take a moment and share a few of the announcements with you.
Announcements from Pass
2017 Pass Summit
Next year’s Summit will be in Seattle again and will run from 10/31-11/3. Check it out here.
Pass Rebranding, New Logo
Pass announced that we are going through a rebranding. Sometime in early 2017 our new website will launch! This is a peek at the logo; Someone got a great picture during the keynote.
Announcements from Microsoft
Power BI reports in SSRS
Preview of Power BI reports in SQL Server Reporting Services! The Technical Preview is a pre-configured Virtual Machine in the Azure Marketplace that includes everything you need to get started, even sample reports and data. With this update, you can visually explore data and create an interactive report using Power BI Desktop, and then publish that report to an on-premises report server (SQL Server Reporting Services). Read the blog to learn more about this announcement.
SSAS As A Service
They were pleased to announce the availability of Microsoft Azure Analysis Services preview. With Azure Analysis Services, BI professionals can create BI semantic models based on data that resides in the cloud or on-premises. You can access Azure Analysis Services models from Power BI Desktop the same way you connect to SQL Server Analysis Services models today — simply publish from Power BI Desktop to the Power BI service to share insights with others in your organization.
R visuals in Power BI Embedded
This week they also announced support for R visuals in Power BI Embedded. R visuals not only enhance Power BI Embedded with advanced analytics depth, but also offers developers endless visualization flexibility. Embedding data visuals within an app provides analytics in the right user context and with the right timing. Now you can add advanced analytics R visuals such as business forecasts, clustering, and decision trees. See our step-by-step guide on using R in Power BI Embedded.
I am sure there were plenty of other things, but this were the ones that stuck out for me.
Leave a Reply