Inside SQLSaturday
This morning I was having a discussion with my husband about our SQLSaturday location. He is extremely concerned that moving the event further away from downtown Nashville would hurt attendance. I tried discussing it with him but he finally said “I’d like to see the data so we could know where everyone is coming from.” I said well I have all the data give me a minute. 10 minutes later I am Skyping him asking how to share with him the 2 Power BI maps I have made.
How did we get here? I ran the last 2 Nashville SQLSaturday events. Because I took a big leap in ‘14 by moving the date I was constantly looking at registration data. Once the event was over I have the task of supplying the sponsors with their scanned list, since I had to download and save them, I started thinking “What if I put this in a database so then I could play with the data?” You see I am that kind of data person that can’t sleep when I get my hands on new data, I am constantly thinking about what I can do with it. “How can I make it useful and what does it want to tell me?” So I have the last 2 years of data in databases that I sometimes just tinker with, you know until today when it might just prove to be useful.
So here we go, step by step in making some of this data useful and pretty for you.
1. Download the data
If you haven’t already downloaded the data you’ll need to login to the SQLSaturday admin site and hit the reports menu. (below)
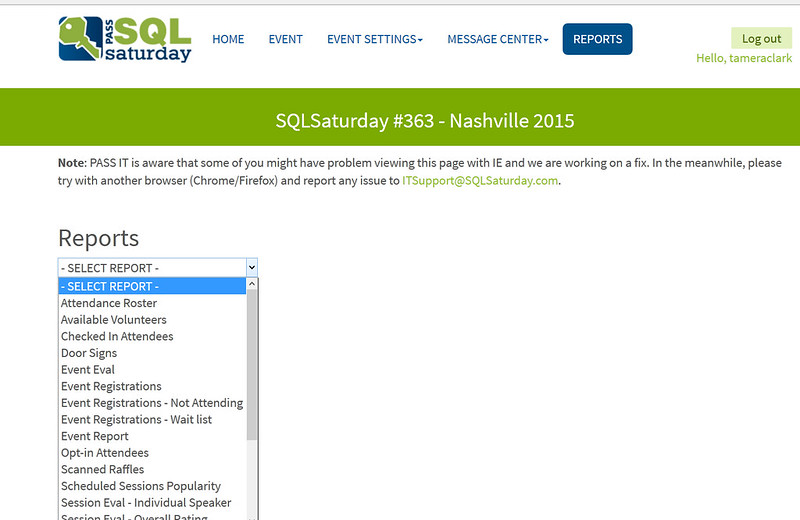
For this visualization you’ll want to grab the Checked In Attendees and Event Registrations. I personally didn’t see that great of a difference in the two but it does lead you to wonder other things like “does location from venue show a trend in lower attendance?”
2. Import your data into a database
Now you could connect Power BI directly to the Excel sheets but I prefer to have the ability to look around and use the data for other things. Plus this data will more than likely need a little clean up, I find this easier to do in a database.
3. Review your data
Your data needs to be clean. And unfortunately, even though this is an event for IT professionals, you will find some wise guy types something in the Postal Code (ZIP) that you don’t want. Being in the US we know ZIPs are 5 digits. Based on the data I was able to download (prior to the SQLSaturday site upgrade) the Checked IN report doesn’t have a REGID or Postal Code but Registrations does. So you do need both lists. You’ll want to clean up any oddities.
REGID PostalCode
131094 23692
130722 Nashville
129681 37211-5119
130339 42104-7632
127937 37027
130219 37027-2852
127872 Indiana
129318 V1Y8G7
131133 GA. 30039
Here I just look for postal codes with a length greater than 5. As you can see I need to fix a few. I also found a slew of items with –1 in the Region and several folks in Texas have a TE region. How you limit the data to display is up to you. I have decided that I will clean up the data and only show the registrations in TN; this allows the map to be zoomed at the state level and is truly showing what is important for this exercise.
4. Write your query
There are always alternate ways to accomplish tasks, but for this quick exercise I am going to just connect to my local database and run a couple of queries. Here I have a query for Registrations and one for Attendees. Since the Checked In report is missing REGID and PostalCode I join to the registrations. I could easily write an update and insert this data if I thought I would be using it for other things.
SELECT COUNT(REGID) AS 'Number of Registrations', PostalCode

  FROM [SQLSat363].[dbo].[EventRegistrations]

  WHERE Region = 'TE' –WHY TE is the region I will never know, TN is the official state abbreviation.

  GROUP BY PostalCode


SELECT COUNT(*) AS 'Number of Attendees', E.PostalCode

    FROM  [SQLSat363].[dbo].[CheckedIN] AS C

          JOIN [SQLSat363].[dbo].[EventRegistrations] AS E on C.email = E.email

    WHERE E.Region = 'TE'

    GROUP BY E.PostalCode
5. Power BI
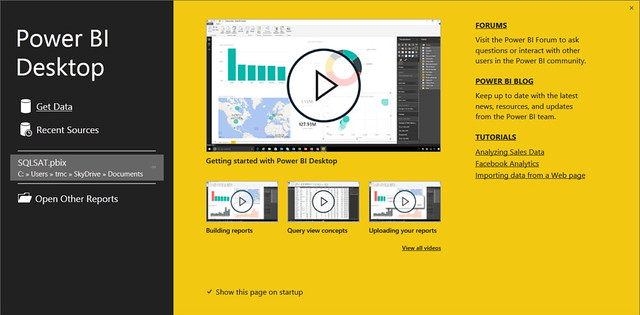
Launch the Power BI Designer (desktop application). If this is your first time using Power BI Designer or you’ve left the “Show this page on startup” checked. You’ll see a screen similar to this (below).
6. Get your data
Select Get Data & SQL Server, your pop up will change to (below)
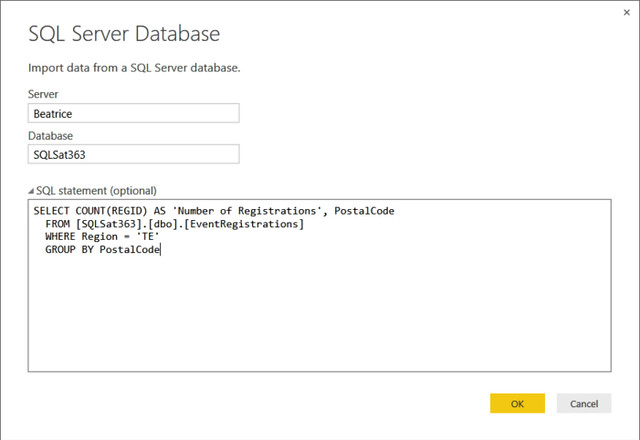
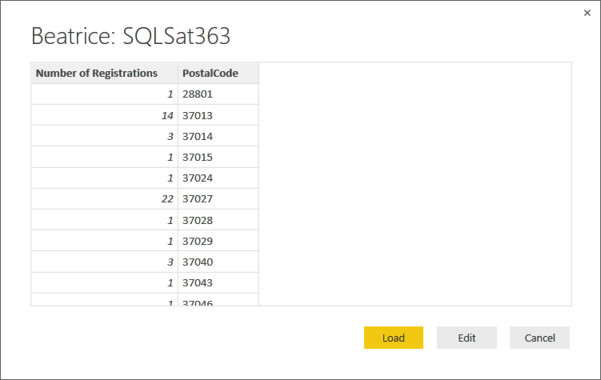
Fill in your Server, if you expand SQL Statement, Database becomes required. Paste your query into the box and select ok. After a few seconds you’ll now see a preview of the data you are requesting (below). Since we don’t need to edit the query we can select load and continue.
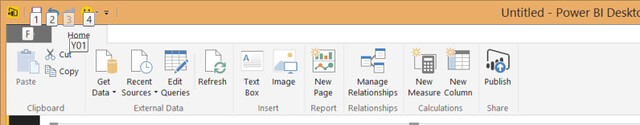
You need to repeat this process to retrieve the other dataset. You can select “Get Data” from the HOME tab in the ribbon (below). I only did both queries to visually see if there was a difference between attendee and registration, but realistically you get what you need from either query.
7. Create the visualization
By selecting the Map under visualizations a blank map will appear on the report canvas and the data fields will become available. (below) You can drag and drop the your query fields from the FIELDS list into the appropriate area.
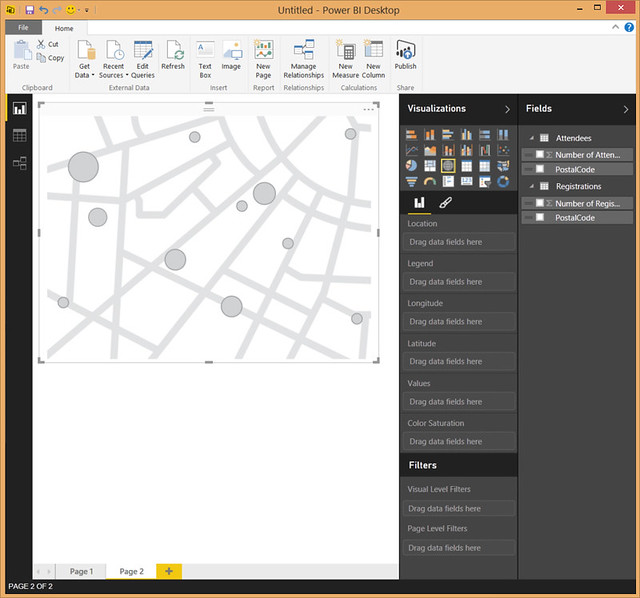
Drag your measure “Number of Attendees” to Values and “PostalCode” to Location.
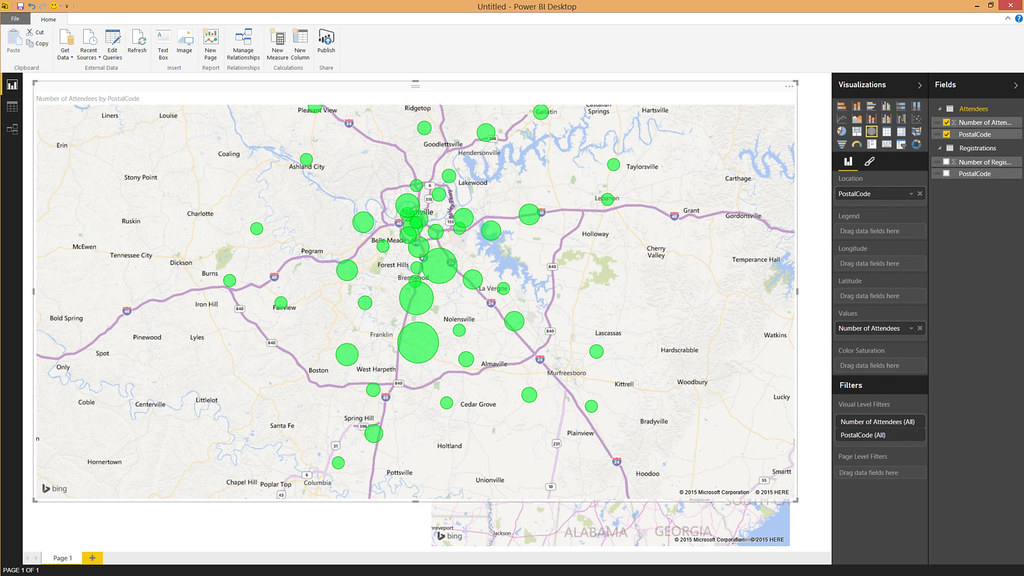
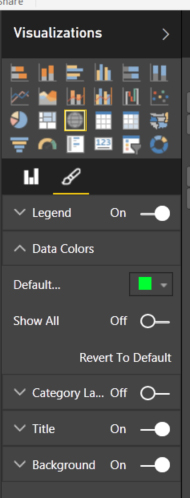
To format your visualizations select the paint brush (below). You have options to turn on a legend (I don’t recommend), you can edit the title and even change the color under Data Colors. All categories expand when you click on the carat. I updated the colors to represent the SQLSaturday logo colors.
Repeat to add another map.
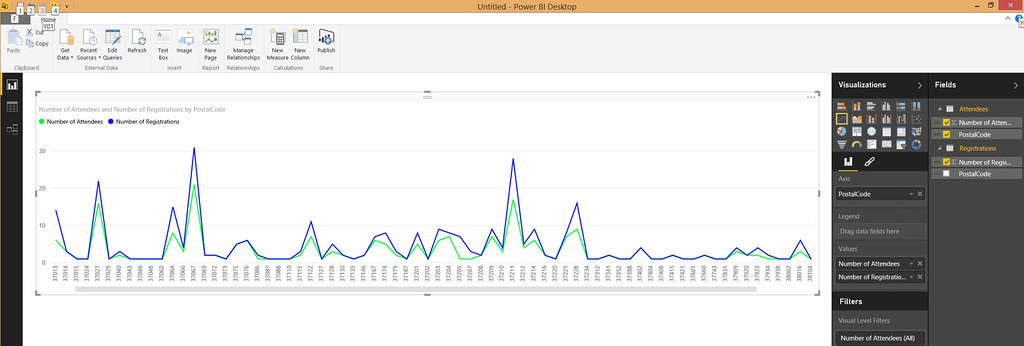
8. Add an extra
For fun you can add a line chart visualization to the report canvas. Drag and drop “PostalCode” to the Axis and your measures “Number of Attendees” & “Number of Registrations” to Values.
9. ENJOY
I hope you found this as fun and as useful as we did.
Leave a Reply